

Paul Kleinrath
Key Takeaways
- Evolit and Sclable are researching new approaches to train prediction together with ÖBB-Infrastruktur AG.
- A purpose-built influence pipeline brings different influencing factors – such as the timetable or running time calculations – onto a shared data basis.
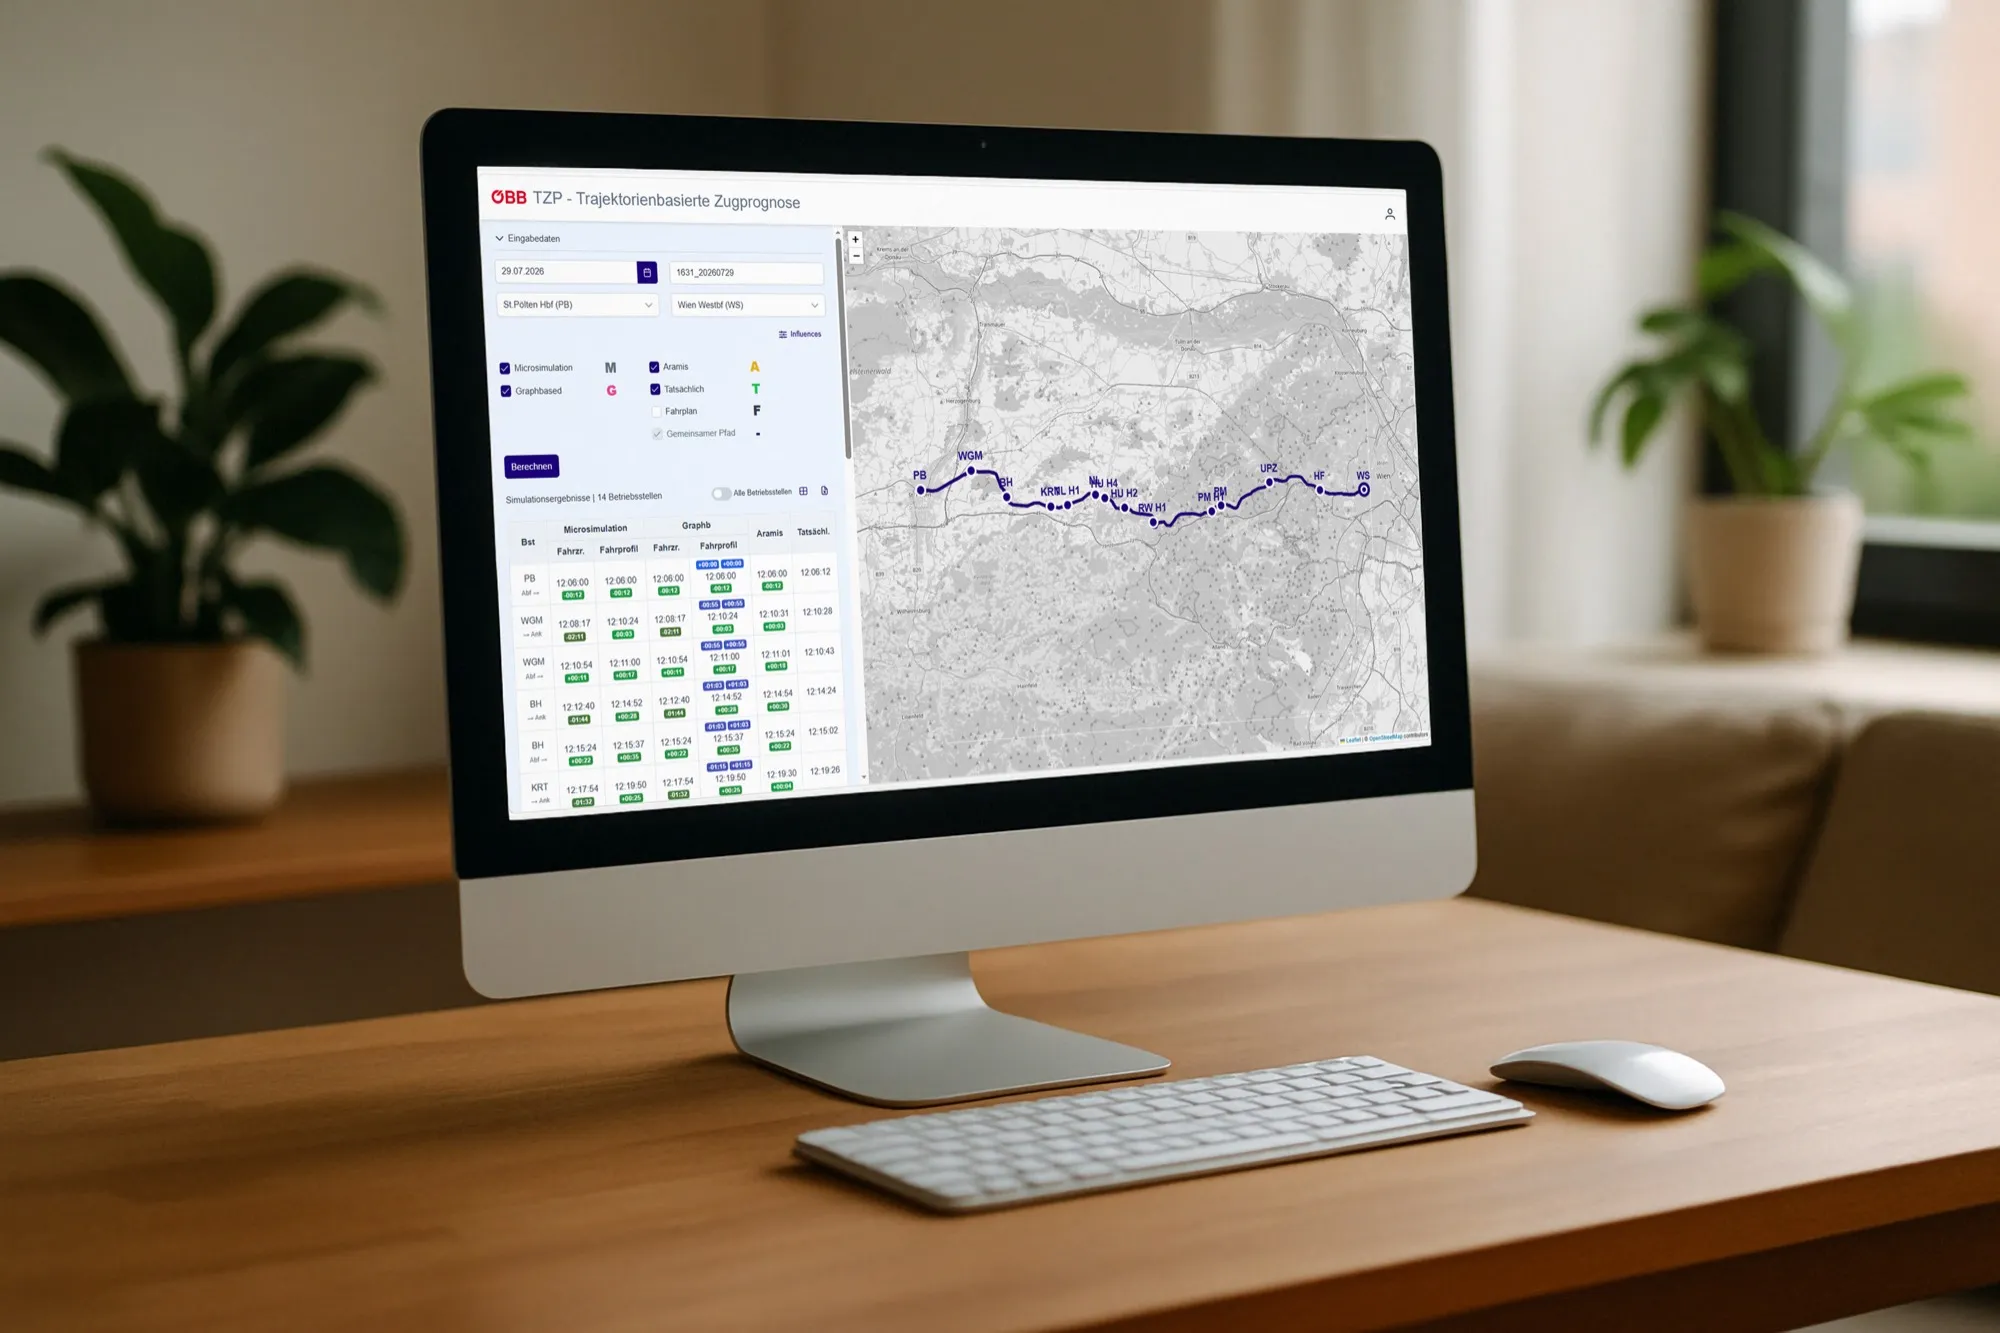
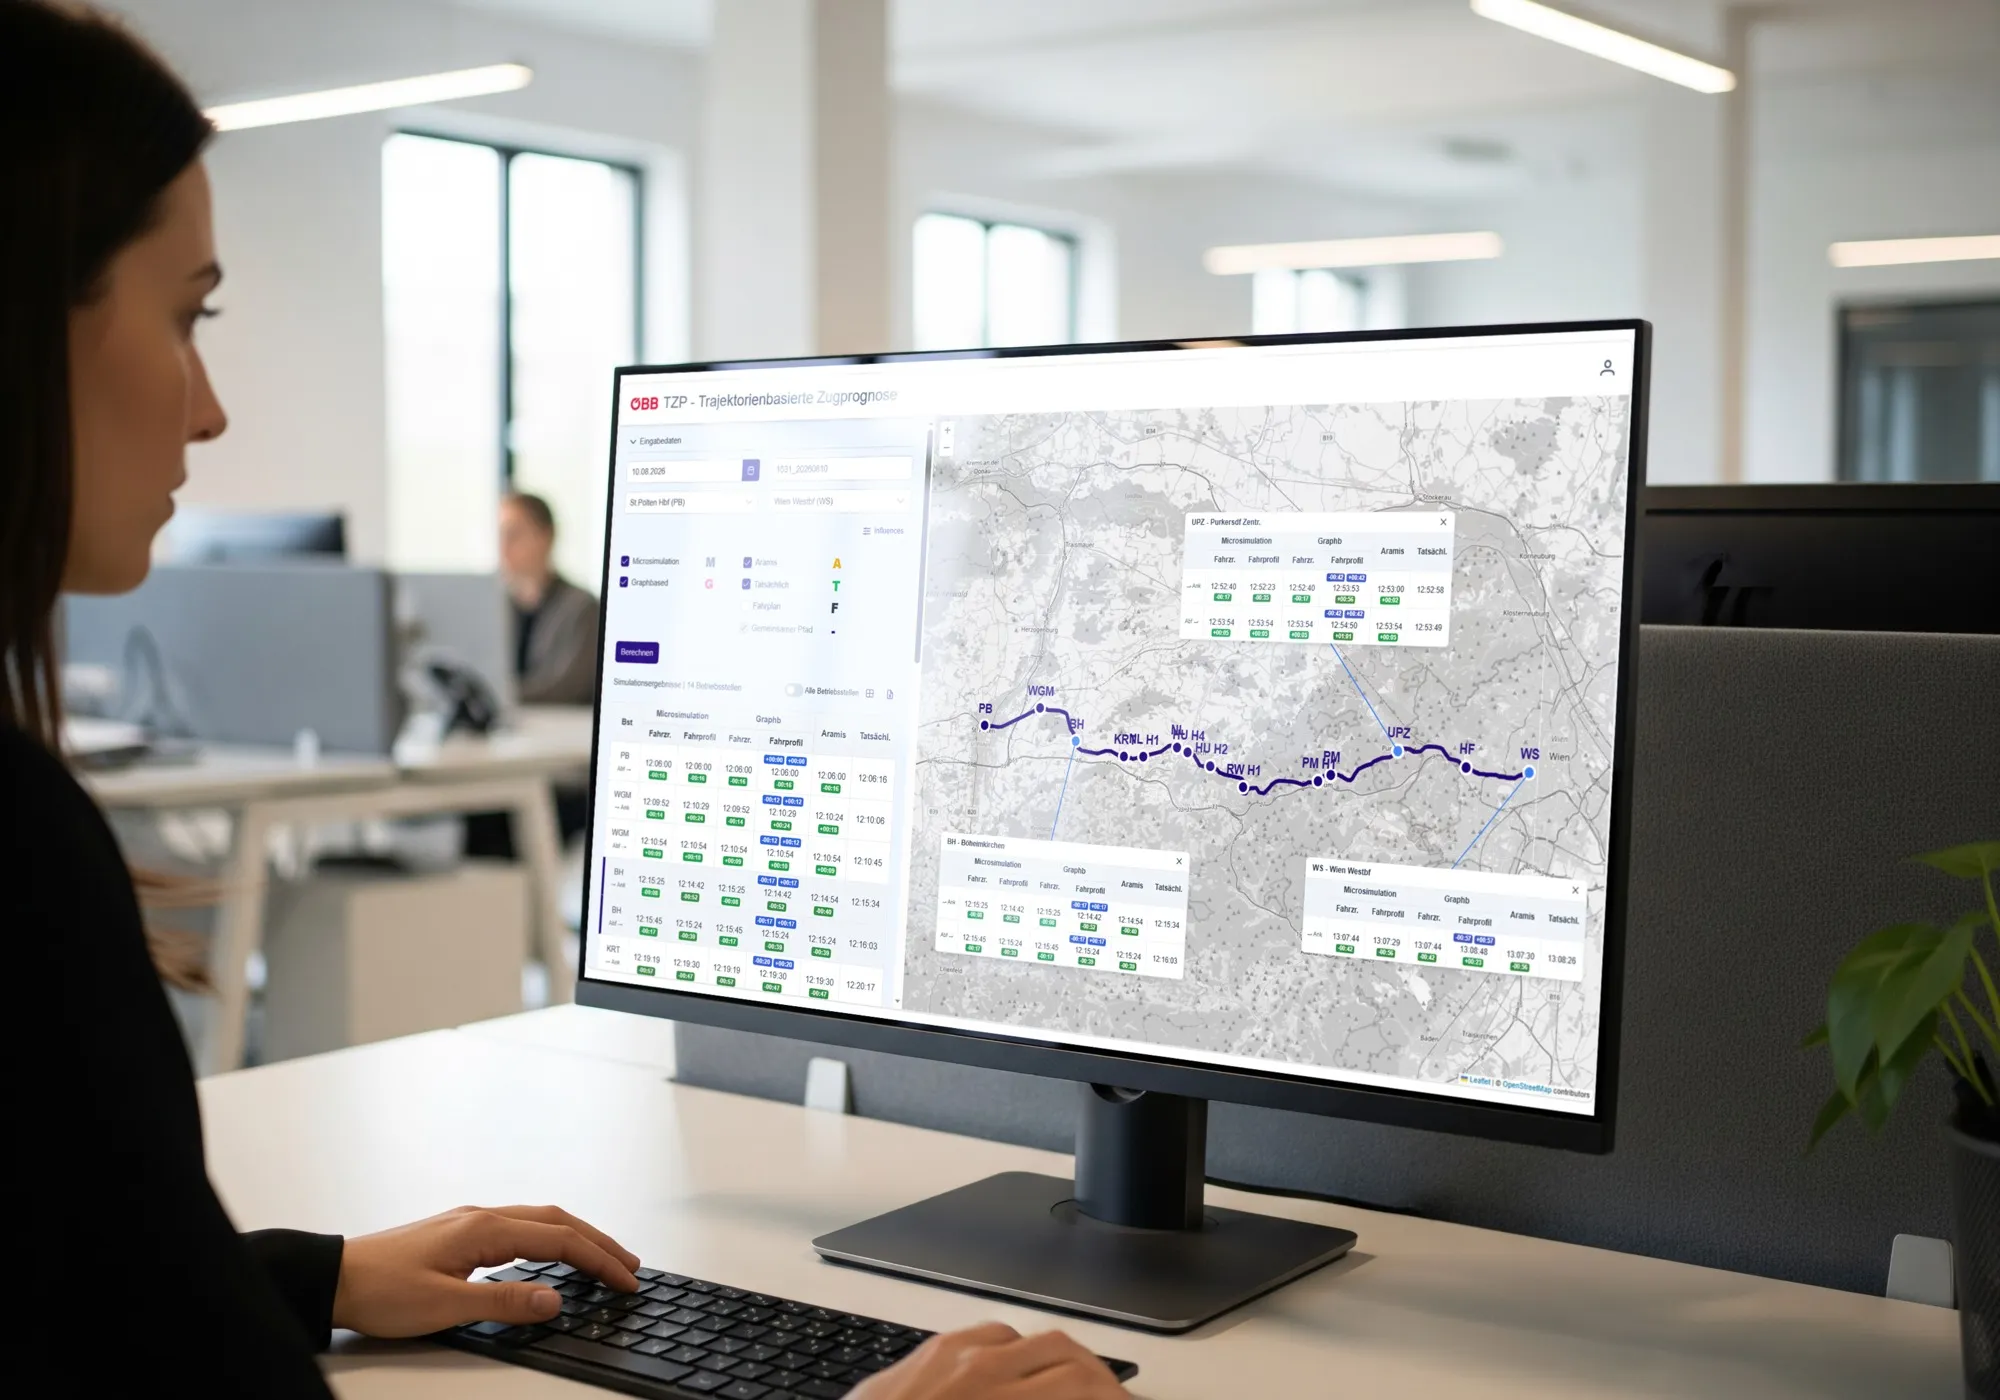
- A user interface presents the predictions in tables and on a map, including alternative paths and the results at each operating point along the train run.
- In spring 2026, the project won two awards at AIR Salzburg, among them “The Most Promising AI Project”.
Whether a train arrives on time depends on many factors. The relevant information sits in different systems, and a large number of train connections has to be considered every day. Producing reliable time predictions is therefore difficult and labour-intensive.
That is why ÖBB-Infrastruktur AG launched a research initiative. Together with Evolit and its partner Sclable, the Trajectory-Based Train Prediction was created: a system that models rail operations as a probabilistic, edge-weighted graph and derives time and journey predictions from it.
The Starting Point: Many Systems, Many Influences, Difficult Predictions
Time and journey predictions are among the most demanding tasks in day-to-day rail operations. Every prediction has to take a multitude of influencing factors into account and weigh them up. Then there is the infrastructure itself: it has to be modelled in all the necessary detail, right down to individual track plan nodes.
Train predictions are also inherently subject to uncertainty. Purely rule-based or static logic reaches its limits here, because it can only partially represent probabilities and the interplay of many influencing variables. What was needed, therefore, were new, data-driven concepts – as a building block on the way to AI-supported traffic management.
It all started with a research question: how can the complexity of rail operations be modelled so that train runs can be calculated efficiently, different influencing factors taken into account and various forecasting methods compared?
Analysis & Approach: Building on Experience, Modelling Influences Generically
The project did not start from scratch. In a preliminary project, Evolit and Sclable had jointly developed a tool for signallers that analyses conflicts within a traffic control area and proposes solutions. The methods and calculation approaches for train prediction developed there fed directly into the new project.
The Influence Pipeline: A Common Denominator for All Methods
Together with ÖBB-Infrastruktur AG, the team developed an architecture that models a wide range of influencing factors generically: the influence pipeline. It brings all influencing variables – such as running time calculations or connecting trains – together in a uniform form. Instead of supplying each model with its own input data, different methodological approaches can be compared fairly and new approaches added step by step.
Artificial intelligence was used deliberately in data analysis: Sclable applied it to analyse the influencing factors, creating the information basis for the influence pipeline. For calculating the train runs, Evolit relied on classical algorithms and graph theory. That combination is what defines the approach: AI extracts additional insights from complex data, and the transparent graph-based method makes them usable for rail operations.
The work was organised in short sprints: an interdisciplinary team from ÖBB, Sclable and Evolit brought rail operations know-how, mathematics and software development directly into the research.
Implementation & Solution: The Rail Network as a Graph
From Track Plan Node to the Most Probable Path
The solution is based on a complete representation of the relevant infrastructure in a graph database: all track plan nodes were recorded. On that basis, the system calculates possible routes directly on the modelled rail network while taking infrastructure restrictions into account.
One technical highlight lies in the structure of the graph itself: the node-based graph was transformed into an edge-based graph. The reason is a practical one: a track plan node may not be traversed in every direction. Only the additional information on the edges correctly represents the permitted directions of travel. On this projected graph, the system searches for a train’s most probable path. A substantial part of the research work consisted of investigating suitable algorithms for this and comparing them in terms of computing time, stability and result quality.
An Interface That Makes Methods Comparable
So that the results can not only be calculated but also analysed, a dedicated user interface was built. Users select a train run, examine individual sections and define which influencing factors and calculation methods are to be compared – microsimulation and graph-based calculation, for example. Alongside the calculated results, the timetable and the actual train run can also be set side by side.
The interface presents the results in tables and on a map showing the train run with all operating points. For individual operating points, the detailed results of the various models can be examined, including alternative paths in the case of the graph model. This makes it visible how the individual models arrive at their predictions and where their results differ.
Results & Benefits: Influences Made Visible, Methods Made Comparable
The Trajectory-Based Train Prediction has created a solid technical foundation for further research into data-driven forecasting methods. The first project phase is deliberately dedicated to analysis, not yet to use in planning. Its success is therefore not measured against classic productivity metrics such as time savings or forecast accuracy. The result is an AI-supported simulation prototype that models train journeys across the entire system. In the long term, it is intended to become the basis for offering colleagues in operations genuine decision support – especially during disruptions, when every minute counts.
Identifying and assessing influencing factors
The effects of individual influencing factors on a train run can now be identified, assessed and compared directly with one another – a new kind of transparency in dealing with predictions.
Methods in direct comparison
The different calculation methods can be compared at a glance: microsimulation, graph-based model and timetable go head to head – on an identical data basis, thanks to the influence pipeline.
Two Awards at AIR Salzburg 2026
That the approach is convincing is also confirmed from the outside: at AIR Salzburg in spring 2026, the project received two awards – “The Most Promising AI Project” and “The Most Promising Digital Innovation Project”.
More on "Mobility"
Mobility
ETCS Key Management System for Trafikverket: Secure Key Management for Sweden's Railways
Evolit and Trafikverket are jointly developing an ETCS Key Management System with online key distribution for secure rail operations in Sweden.
Mobility
Digital Train Preparation in Rail Freight: PORTHOS at ÖBB
With PORTHOS, ÖBB-Infrastruktur is digitalising the planning, dispatching and execution of train preparation – from train path ordering to automated train data reporting.

Mobility
Automatic Warning Systems: The Data Foundation for Safe Work on the Track
How Evolit modernised the data foundation of an automatic warning system in rail operations: a web application with versioning, SSO and RFID integration.